|
India’s 2026 Southwest Monsoon Deficit at 14.7% Below LPA Amid Strong El Niño
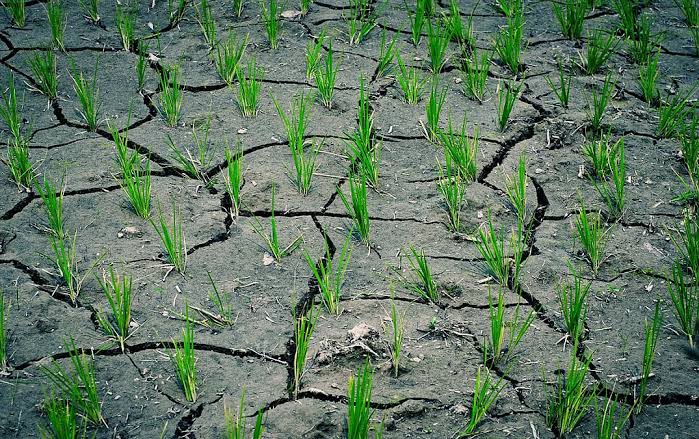
India’s 2026 southwest monsoon currently records erratic, deficient rainfall, linked in the report to a strengthening El Niño. The article flags updated monsoon shortfall, low-pressure system (LPS) patterns, crop indicators, and global food-price indices as present triggers for food inflation concerns.
2026 Southwest Monsoon Conditions and Food-Price Indicators:
| Dimension | Key Details |
|---|---|
| Cumulative monsoon rainfall status | Cumulative all-India rainfall comprises a 14.7 per cent deficit below the long-period average (LPA) as of September 13. |
| Monthly monsoon pattern (June-August 2026) | The season’s month-wise performance comprises: June, 0 LPS and rainfall 38 per cent below LPA; July, 4 LPS with 24 LPS days and rainfall 1 per cent above LPA; August, 6 LPS with 26 LPS days and rainfall 16.3 per cent below LPA. |
| Low-pressure systems (LPS) and rainfall mechanism | A low-pressure system comprises warm, moist air near the ground rising, cooling, and condensing into clouds that bring rain. |
| Meteorological subdivisions: deficiency count | Deficiency above 10 per cent applies to 24 of India’s 36 meteorological subdivisions. |
| Worst-affected regions | The worst-affected areas comprise the southern states, Marathwada, and Vidarbha. |
| Rainfall concentration | Rainfall is largely confined to Odisha, Chhattisgarh, eastern Madhya Pradesh, Gangetic West Bengal, Jharkhand, and Uttar Pradesh. |
| Kharif acreage | Total kharif acreage comprises 1,096.5 lakh hectares as of September 11, which is 1.4 per cent below 1,112.5 lakh hectares for the same period in 2025. |
| Fertiliser sales indicator | Fertiliser sales comprise significantly lower sales of di-ammonium phosphate, muriate of potash, and complex fertilisers in April–July 2026 than a year earlier, and urea sales comprise a 6.6 per cent fall. |
| Production forecasts | The US Department of Agriculture projection comprises India’s rice output at 147 million tonnes from last year’s record 154 mt, and maize at 50 mt from 55.1 mt. |
| Current El Niño ocean condition | El Niño currently comprises sea surface temperatures in the equatorial Pacific off Ecuador and Peru at about 1.8°C above normal. |
| NOAA El Niño probability and intensity outlook | The US National Oceanic and Atmospheric Administration outlook comprises: over 90 per cent chance of a very strong El Niño (SST more than 2°C above normal) from September to January; strong conditions (more than 1.5°C above normal) till March; weak-to-moderate conditions (0.5°C to 1.5°C above normal) till May. |
| Rabi crops stated as most at risk | The rabi crops most at risk comprise wheat, rapeseed-mustard, chana, masoor, matar, potato, onion, garlic, jeera, saunf, and dhaniya. |
| FAO Food Price Index: latest level and reference points | The FAO Food Price Index comprises 133.3 points in August, the highest since November 2022, and remains below the all-time high of 160.2 in March 2022. |
| FAO Food Price Index: construction | The index comprises a weighted average of world food commodity prices against a 2014–16 base of 100. |
| FAO sub-indices cited | The FAO vegetable oil index in August comprises the highest level since June 2022, and the cereals index comprises a 27-month high. |