UPSC CSE Prelims 2018
The graph given below indicates the changes in Key policy rates made by the Central Bank several times in a year
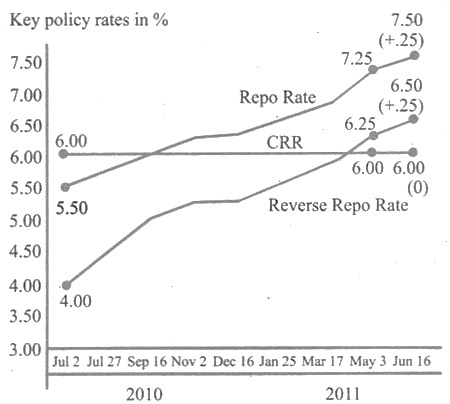
Which one of the following can be the most likely reason for the Central Bank for such an action?
EXPLANATION
Correct Option (D)
An anti-inflationary stance by the Central Bank typically involves increasing key policy rates such as the Repo Rate and Reverse Repo Rate. This action makes borrowing more expensive for commercial banks, which subsequently leads to higher lending rates for consumers and businesses. The objective is to reduce the overall money supply and aggregate demand in the economy, thereby mitigating inflationary pressures.
Incorrect Options:
Option (A): Encouraging foreign investment
While higher domestic interest rates can attract foreign portfolio investment seeking better returns, the primary and most direct reason for a Central Bank to repeatedly adjust key policy rates, as implied, is usually to address domestic macroeconomic stability, particularly inflation. Encouraging foreign investment is often a secondary effect rather than the principal driver of such a monetary policy action.
Option (B): Increasing the liquidity
Increasing liquidity in the banking system and the broader economy is typically achieved by reducing key policy rates. Lower rates make borrowing cheaper, encouraging banks to lend more and expanding the money supply. Conversely, an anti-inflationary stance, which involves raising rates, aims to reduce liquidity to curb demand-pull inflation. Therefore, this option contradicts the likely action.
Option (C): Encouraging both public and private savings
Higher interest rates, resulting from increased policy rates, can incentivize savings by offering better returns on deposits. However, this is generally a secondary outcome of monetary policy primarily aimed at controlling inflation and managing the money supply. The direct and most impactful reason for such significant policy rate adjustments is typically macroeconomic stabilization, not solely the promotion of savings.