UPSC CSE Prelims 2018
Consider the following figures A and B:
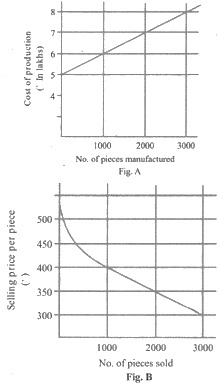
The manufacturing cost and projected sales for a product are shown in the above figure A and B respectively. What is the minimum number of pieces that should be manufactured to avoid a loss?
EXPLANATION
Correct Option (1)
To avoid a loss, the total revenue generated from sales must be equal to or greater than the total manufacturing cost. This point, where total revenue precisely equals total cost, is known as the break-even point, signifying neither profit nor loss.
Given a selling price of ₹350 per piece, and the information that the total cost for manufacturing 2,000 pieces is ₹7,00,000:
- Total Revenue for 2,000 pieces = 2,000 pieces × ₹350/piece = ₹7,00,000.
Since the Total Revenue (₹7,00,000) equals the Total Cost (₹7,00,000) at 2,000 pieces, this quantity represents the minimum production level required to avoid incurring a loss. Manufacturing fewer than 2,000 pieces would result in a loss.
Incorrect Options:
Options 2500, 3000, and 3500 represent production volumes greater than the break-even quantity of 2,000 pieces. While manufacturing these quantities would result in a profit (as total revenue would exceed total cost) and therefore avoid a loss, they do not represent the minimum number of pieces required to achieve this condition. The question specifically seeks the lowest production volume that prevents a loss, which is the break-even quantity.