Q 21 / 46
UPSC CSE Prelims 2015
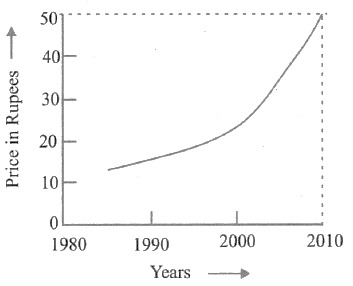
Year-wise variation of the price of a certain commodity is shown in the following graph:
The price of the commodity in the year 1990
EXPLANATION
Correct Option (3)
The provided data indicates that the commodity's price consistently remained within the range of Rs. 10 and Rs. 20 throughout the entire period depicted, including the year 1990. While a precise single value for 1990 is not specified, its price is definitively bounded by these minimum and maximum values.
Incorrect Options:
The data does not specify a singular price for the commodity in 1990. The price is shown to fluctuate within a defined range.
- Option 1 (must have been 10/-): The price could be Rs. 10, but it is not exclusively Rs. 10. The data shows the price varies between Rs. 10 and Rs. 20.
- Option 2 (must have been 12/-): There is no specific indication that the price in 1990 was exactly Rs. 12. This value falls within the possible range but is not a definitive price point.
- Option 4 (is higher than that in the year 1991): The visual representation does not provide sufficient detail to make a definitive comparison between the exact price in 1990 and 1991. While prices fluctuate, a conclusive statement regarding their relative values cannot be established without specific data points for both years.