UPSC CSE Prelims 2014
The following graph shows the average profit of two fruit-sellers A and B in thousands (Rs) per year five the year 1995 to 2000. Consider the graph and answer the question:
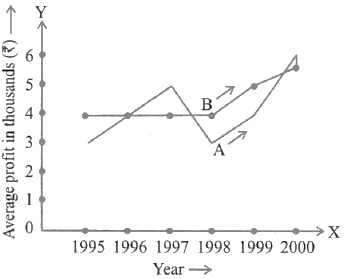
In which year is the average profit of A and B same?
EXPLANATION
Correct Option (2)
The average profit of two entities, A and B, is considered identical in the year where their respective profit curves intersect on the given graph. An intersection point signifies that both entities achieved the same profit value at that specific time.
Upon examining the provided graph, the lines representing the average profit of fruit-seller A and fruit-seller B converge and intersect precisely in the year 1996. This indicates that their average profits were equal during that year.
Incorrect Options:
Options 1 (1995), 3 (1997), and 4 (1998) are incorrect because, in these years, the profit curves for fruit-seller A and fruit-seller B do not intersect. This signifies that their average profits were distinct and not equal in these particular years, as visually represented by the separate positions of their respective lines on the graph.