Q 32 / 46
UPSC CSE Prelims 2013
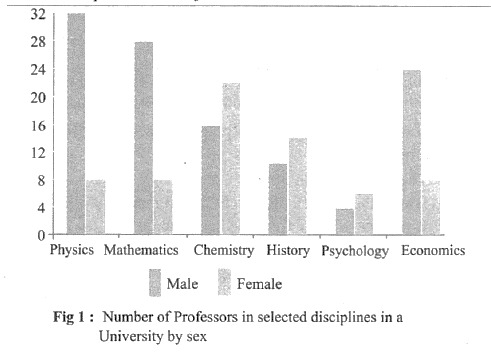
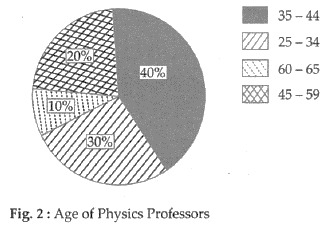
Study the two figures given below and answer the question that follow:
How many Physics professors belong to the age group 35-44?
EXPLANATION
Correct Option (2)
The total number of Physics professors is derived by summing the constituent groups, which are 32 and 8, resulting in a total of 40 professors.
The number of these professors belonging to the 35-44 age group is specified as 40% of the total.
Calculation:
- Total Physics professors = 32 + 8 = 40
- Physics professors in 35-44 age group = 40% of 40 = (40/100) × 40 = 16
Therefore, 16 Physics professors are within the 35-44 age demographic.
Incorrect Options:
Options 1 (18), 3 (14), and 4 (12) are incorrect as they do not correspond to the calculated number of Physics professors in the 35-44 age group based on the provided data and specified percentage.